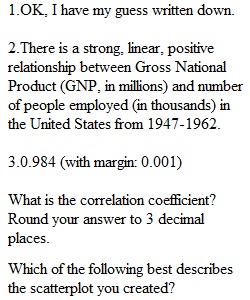
Q Question 1 2 / 2 pts In the video below, you all will learn how to create a scatterplot and find the correlation coefficient for two quantitative variables. This is a picture of the scatterplot you will create: Before starting the video, I want you to make your best guess as to what the correlation coefficient could be. Take a moment to write it down. I just want you to compare what you think the correlation coefficient is with the true value. Question 2 2 / 2 pts Creating a scatterplot and obtaining the correlation coefficient Which of the following best describes the scatterplot you created? Question 3 2 / 2 pts What is the correlation coefficient? Round your answer to 3 decimal places. Question 4 2 / 2 pts Adding the regression line to the scatterplot If the goal is to evaluate whether we have a linear trend or not, do you prefer to look at a scatterplot with or without the regression line? This is an opinion question. To give you all credit, type in the number that corresponds with your answer: 1 = I prefer to use the scatterplot without the regression line 2 = I prefer to use the scatterplot with the regression line Question 5 3 / 3 pts Obtaining regression output Use the drop down options to create the regression equation using the regression output from summary(lmod) y^ = 51.84 + 0.0348 x
View Related Questions